In 1989, in a research ward at the Hebrew Rehabilitation Center in Boston, Dr. Maria Fiatarone enrolled ten frail nursing home residents in a strength training protocol that ran against the clinical consensus of the era. The mean age was 90. The youngest subject was 86. The oldest was 96. Eight of the ten had fallen in the previous year. Seven habitually used a cane, walker, or wheelchair. Each subject carried an average of four and a half chronic diagnoses and took four daily medications. The protocol was eight weeks of progressive resistance training, three days a week, working at 80% of their tested one-rep max. Strength was retested every two weeks and the load adjusted upward.
Eight weeks later, the average gain in leg strength was 174%. Two subjects who had needed canes at baseline no longer needed them. One subject who could not stand from a chair without using their arms could now stand without help. Tandem gait speed had improved 48%. Dr. Fiatarone published the results in JAMA in 1990.1 Four years later, she performed a larger randomized controlled trial in 100 nursing home residents, which showed mean strength gains of 113% in the exercise group.2 The aging musculoskeletal system, the second paper concluded, “retains its responsiveness to progressive resistance training.” Thirty-six years later, strength standards for older adults are still treated by most clinicians and most lifters as if her findings were exceptional rather than typical.
The data we have now describes a different reality. This article walks through what those standards actually look like across the population spectrum, where the numbers come from, and how to use them without confusing description with prescription.
If you are searching for strength standards, you are probably trying to compare your
squat, bench press, deadlift, or general
strength level against other lifters. The charts below explain what recreational lifters
and competitive powerlifters actually lift, how strength differs by bodyweight,
age, and sex, and how to use these numbers without turning them into
rigid targets.
If you are newer to barbell training, start with our
strength training guide.
If you want a broader explanation of what qualifies as strength training, see our guide to
what strength training is.
What does “strong enough” look like for general adults?
Most readers searching for strength standards are not competitive powerlifters. The most useful starting reference is not what the strongest of trained athletes lifts, but what adults in the general population need to lift to get most of the health benefits of strength training.
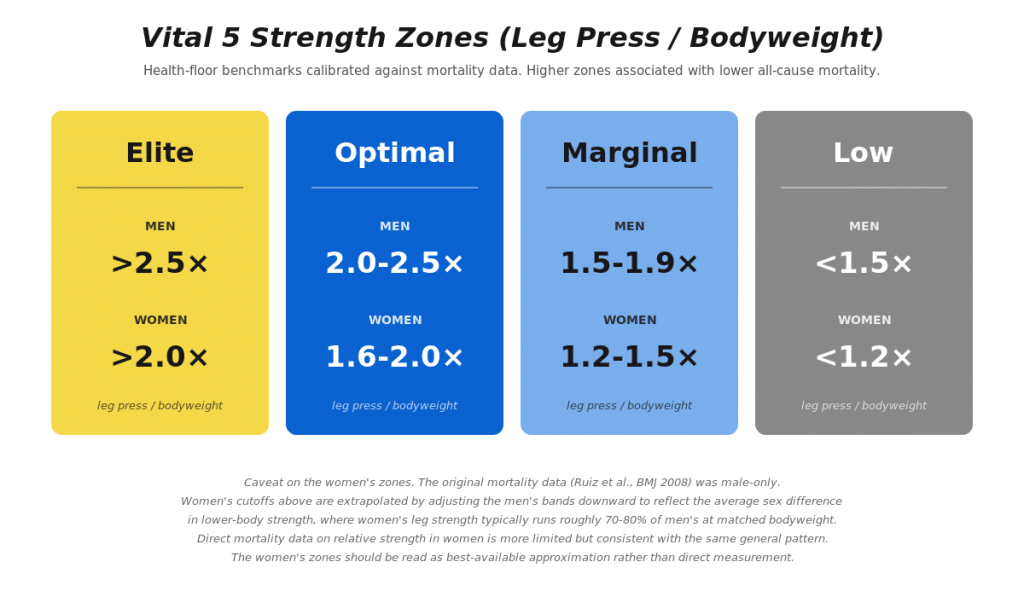
The Barbell Medicine Vital 5 framework anchors that threshold using leg press relative strength, calibrated against the underlying mortality data. The zones for adults look like this:
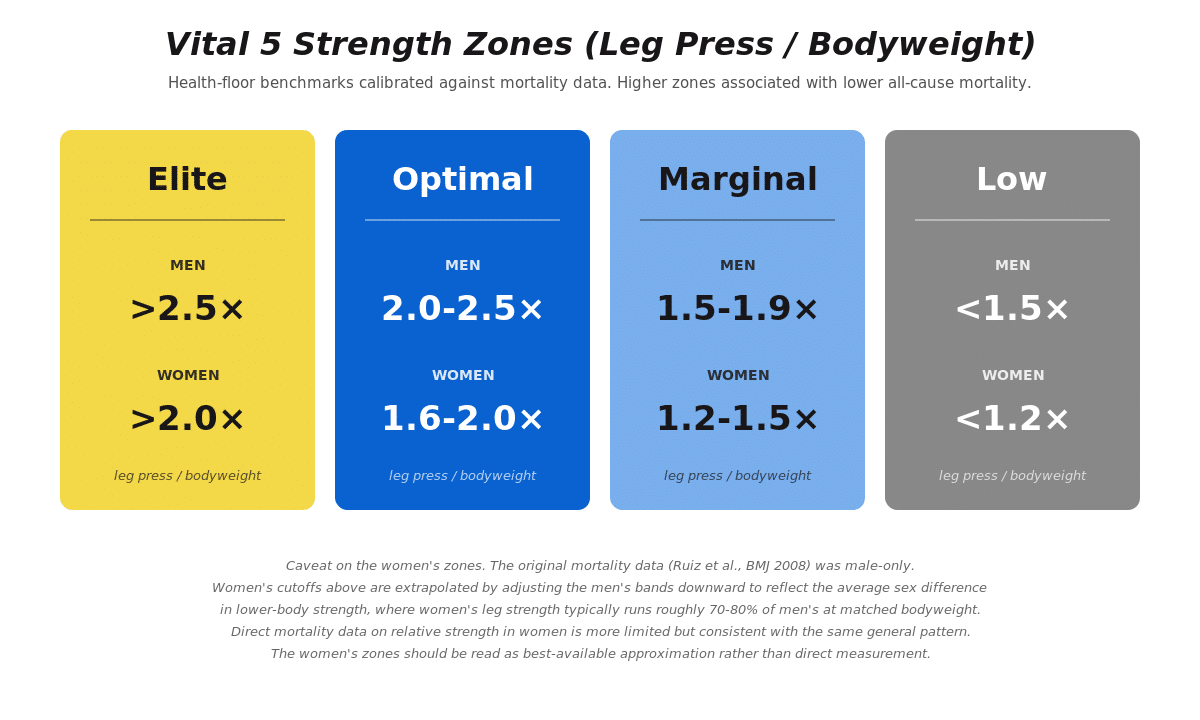
These cutoffs come from analysis of the Aerobics Center Longitudinal Study of 8,762 men aged 20 to 82 followed for an average of 18.9 years.3 The middle and upper thirds of muscular strength were associated with significantly reduced all-cause mortality compared to the lowest third, even after adjusting for cardiorespiratory fitness, age, smoking, alcohol intake, body mass index, baseline medical conditions, and family history of cardiovascular disease. Men in the middle third of strength were 28% less likely to die from any cause during the study window compared to the weakest third. Men in the strongest third were 23% less likely to die. The biggest survival benefit came from moving out of the weakest third, not from moving from strong to elite.
Barbell Medicine Vital 5
Want to know where your strength fits into the bigger health picture?
Strength is one of the five key metrics we use to evaluate long-term health and performance.
The BBM Vital 5 Action Plan explains how strength, aerobic fitness, body composition, blood pressure,
and metabolic health work together — and what to focus on next.
What about strength for recreational lifters?
The other reference point most readers want is “what should I be lifting after a year or two of consistent barbell training?” The numbers below are typical ranges for adults who regularly train the squat, bench press, and deadlift. They are not minimum competence requirements, and individual variation by training history, weight, and program design is substantial.
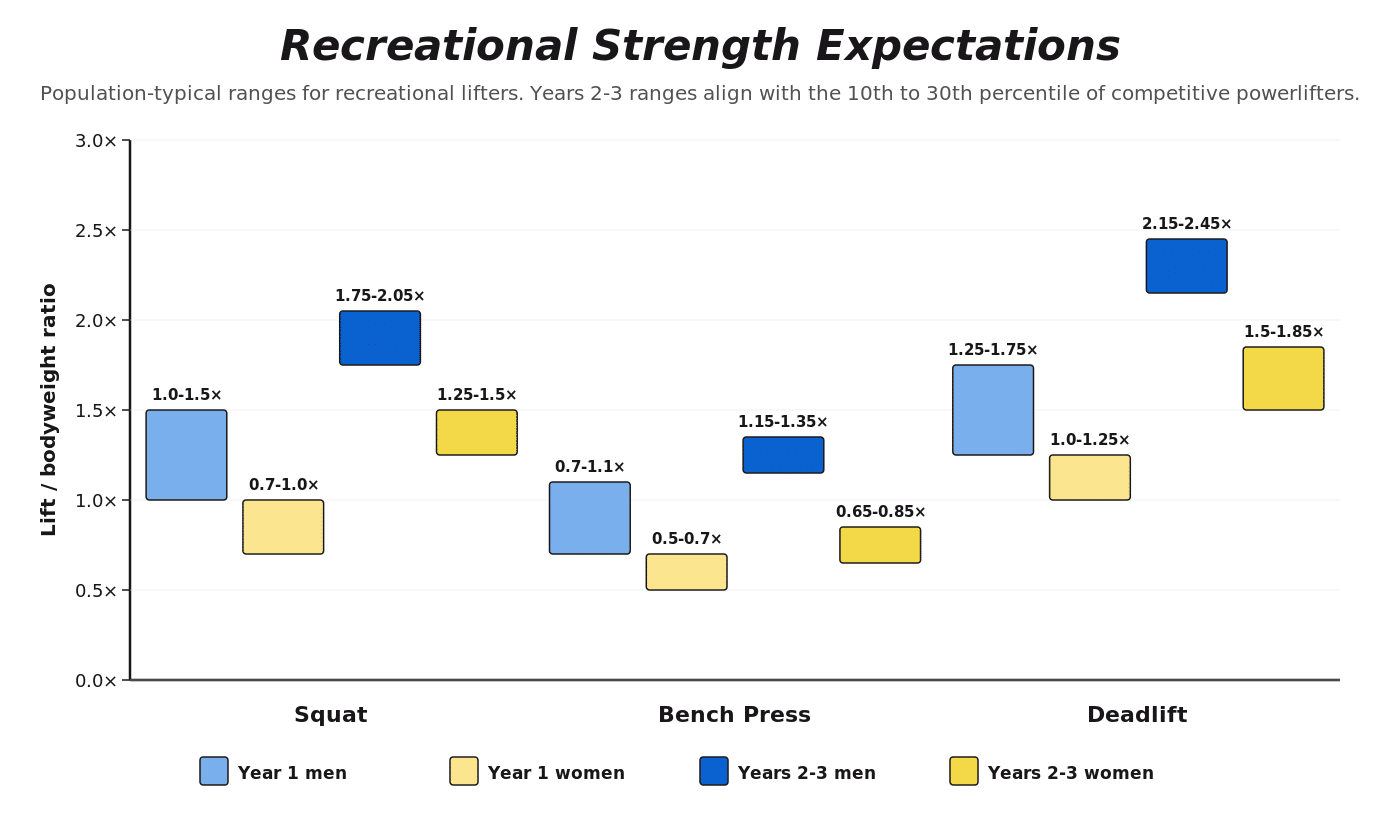
These ranges are calibrated to a dataset of young adult competitive powerlifters (18-35). Older lifters typically show a similar relative response to training, but peak absolute strength declines with age, so ratios will sit below these ranges past about 30 and the gap widens with each decade. Recreational lifters with less training specificity, attendance, or coaching than competitive powerlifters may also land below at the same training duration. A recreational lifter in their second year landing in the middle of the range is doing fine. A lifter who has been training consistently for three years and is still below the year-1 range is a candidate for the conversation in the practical-use section of this article.
Genetic variance in baseline strength is substantial and these ranges describe what populations have achieved on similar training, not what any individual is biologically capable of. The framing that matters: everyone can get stronger from where they currently sit, even if where they currently sit is largely determined by factors outside training.
How strong are competitive powerlifters?
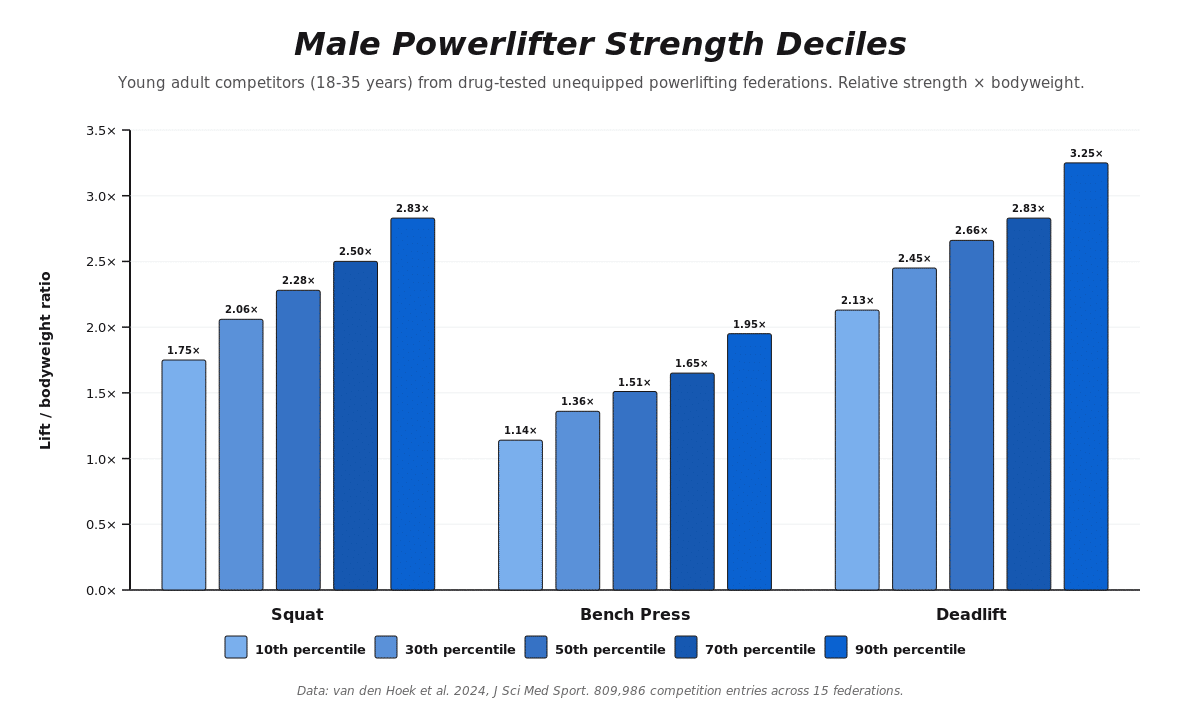
The largest contemporary dataset on strength performance comes from analysis of 809,986 competition entries from drug-tested, unequipped powerlifting federations spanning 1968 to 2022.4 The dataset includes 571,650 male and 238,336 female entries from 15 federations across Africa, Asia, Europe, the Americas, and Oceania. Strength is reported as the ratio of weight lifted to bodyweight at the competition.
For young adult male competitors aged 18 to 35, the squat, bench press, and deadlift relative strength deciles are:
For young adult female competitors aged 18 to 35:
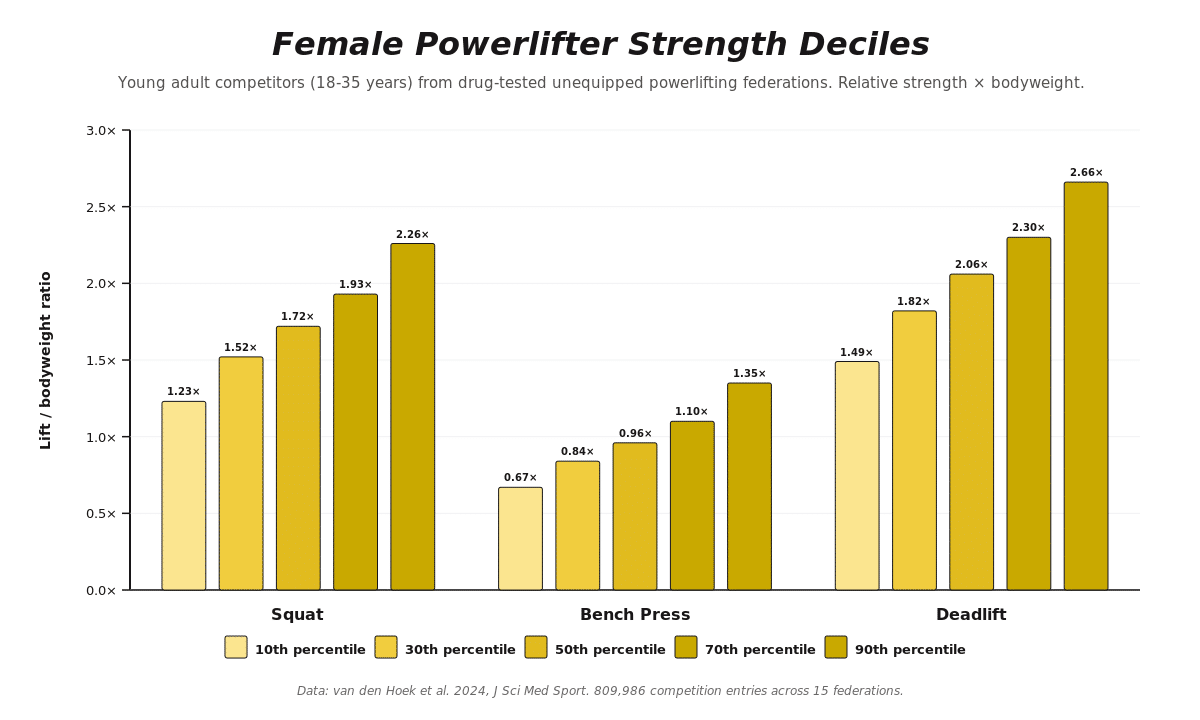
These numbers describe drug-tested, unequipped powerlifters who chose to compete and trained specifically to maximize their strength in the squat, bench, and deadlift. They are the upper bound of what is achievable with persistent, focused training, not population averages. The general adult population, including most recreational lifters, is likely to achieve strength levels well below the 50th percentile of this dataset. The free online calculator at thestrengthinitiative.com lets you plug in age, sex, weight class, and lift to find your exact percentile.
How does strength change across a training career?
A 2024 retrospective study of more than 9,000 powerlifters mapped how strength changes across a training career, from year one through the masters age divisions.⁵ The headline numbers: athletes gain roughly 7.5 to 12.5% in their first year of competitive training, with cumulative gains reaching approximately 20% by the ten-year mark. Female competitors progress slightly faster early in their careers than male competitors, likely because they begin from a lower absolute baseline and have more remaining ceiling to close. The curve is logarithmic rather than linear: most of the relative gain happens in the first two to three years; the next seven to eight years add diminishing returns despite continued absolute improvement.
A common mistake in interpreting this trajectory is the denominator problem. A 5-pound increase on a 135-pound squat is 3.7%. The same 5-pound increase on a 405-pound squat is 1.2%. The absolute pounds added are identical and represent the same amount of new contractile capacity. The trained lifter is moving more weight per session than the novice; the percent change is smaller because the baseline is much higher. Percent change against a moving denominator is a misleading way to track progress in trained lifters, and the broader implication is that “decelerating gains” after the first few years are mostly an artifact of how the gains are measured, not a sign that the underlying physiology has changed.
The full case for why the underlying adaptive processes do not change rate during a training career is in Progressive Loading Part 3, which discusses five lines of converging evidence from neural adaptation through muscle hypertrophy, connective tissue, bone, and fatigue physiology.
How does strength change across the lifespan?
The trajectory of strength across age peaks in early adulthood (20’s) and declines progressively thereafter. For male competitors in the 90th percentile, the squat falls from 2.83× bodyweight in young adulthood to roughly 2.50× in middle age, 2.05× in older adults (60 to 79), and 1.72× in very old adults (80+). The deadlift trajectory is similar: 3.25× to 2.51× to 2.19× to 2.30× across the same bands. Female trajectories follow the same shape with smaller absolute relative-strength values.4
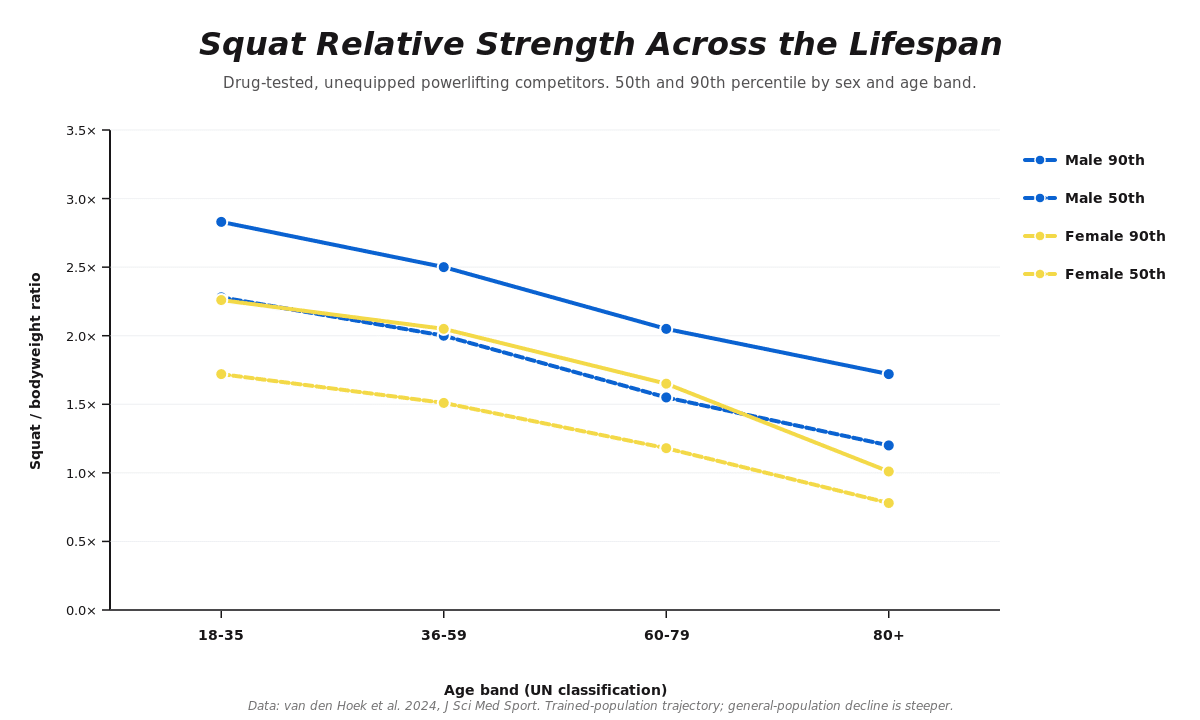
Figure 1. Squat relative strength across the lifespan in drug-tested unequipped powerlifting competitors. Trained-population trajectory; the general-population decline is steeper. Data: van den Hoek 2024, J Sci Med Sport.
The decline is real, but two things complicate the framing.
First, the decline observed in this powerlifting dataset is substantially smaller than the decline observed in general population cohorts. General population muscle strength typically declines by approximately 1-3% per year after age 40, with acceleration after 65. The Latella longitudinal data on masters powerlifters shows that older female masters athletes (over 59) still gain strength at roughly 2.5 to 5% per year, and older male masters athletes (over 69) lose strength at approximately 0.35% per year, roughly one-third the rate of sedentary peers.5 The trained population is a different curve from the population average. The often-quoted “1% per year decline” describes what happens to people who do not train. The picture in trained populations is dramatically more favorable.
Second, even at the tail end of the lifespan, the responsiveness of muscle to progressive loading is preserved. The Fiatarone trials in nursing home residents with mean ages 87 to 90 produced 113% to 174% strength gains over 8 to 10 weeks of high-intensity resistance training.1,2 The LIFTMOR and LIFTMOR-M trials in postmenopausal women and older men with low bone mass produced bone density gains of 2.2 to 4.1% in the lumbar spine and functional improvements with eight months of twice-weekly heavy resistance training.6 These populations respond to actual training the same way younger populations do.
Relative strength does decline with age with continued training, but the decline is slower and the responsiveness of muscle to progressive loading is preserved across nearly the entire span. Strength standards stratified by age describe what populations have achieved, not what individuals at that age are capable of with appropriate training.
What about power, not just strength?
Strength is the ability to produce force. Power is the ability to produce force quickly. The two are related but not identical, and they decline at different rates with age. Muscle mass declines roughly 1% per year after middle age, strength declines 1.5 to 3% per year, and power declines fastest of all. The mechanism is selective loss of high-threshold motor units that drive Type II muscle fibers, which are responsible for rapid force production. As those units are lost, peak force can be partially preserved by the surviving muscle, but rate of force development cannot.
For older adults, lower-body power predicts falls more directly than leg strength alone, which is why the practical functional tests that matter (rising quickly from a chair, climbing stairs without stopping, recovering balance after a trip) are all power-dependent rather than maximal-strength-dependent. The standards in this article cover maximal strength because that is what searchable benchmarks describe; the underlying picture is that maximal strength is one of three muscle qualities (mass, strength, power) that age at different rates.
For the full treatment of why power declines fastest, what that means for falls and functional independence, and what training preserves it, see our article Sarcopenia: What It Is and How to Prevent It.
Are men and women’s strength standards really different?
Men and women perform differently in absolute terms on the squat, bench press, and deadlift. The male in the 90th percentile for the squat (2.83× bodyweight) is higher than the female’s (2.26× bodyweight), and the bench press difference is larger still (1.95× vs 1.35×). These differences are real and reflect average body composition, muscle mass distribution, and training history at the population level.
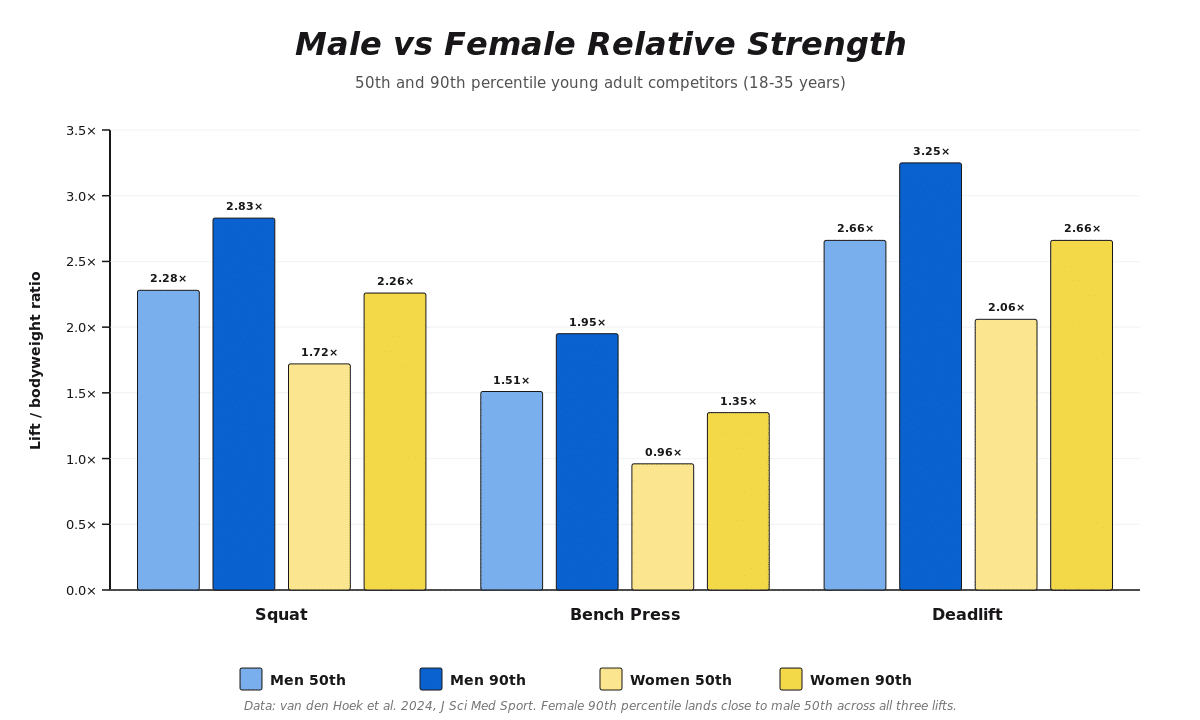
Figure 2. Male vs female relative strength at the 50th and 90th percentiles for young adult competitors aged 18-35. Female 90th percentile lands close to male 50th across all three lifts. Data: van den Hoek 2024, J Sci Med Sport.
What is not true is that men and women respond differently to training. The 2020 meta-analysis by Roberts et al. of resistance training studies using the same program in men and women found no statistically significant difference in hypertrophic response between men and women. Women did show greater relative upper-body strength gains than men in the same studies, driven by larger trainable headroom in the upper body where female absolute strength typically begins lower.7 Lower-body relative strength gains and absolute strength gains differed only modestly. A 2023 narrative review across multiple domains of strength training reached the same conclusion: women’s responses to resistance training are similar to men’s in magnitude, with the main differences being absolute starting points and ceilings, not the rate or quality of adaptation.8
The takeaway here is that programming should be individualized to the lifter’s training history, current capacity, and goals, not to their sex. Programs do not need to be “made for women” or “made for men”. They need to fit the person in front of you.
What do beginner, intermediate, and advanced actually mean?
Most strength standards charts on the internet rank lifters as beginner, intermediate, advanced, and elite based on bodyweight performance. These labels are widely used and widely misunderstood.
The labels describe approximately how long it takes to observe an improvement in performance. An untrained lifter’s monthly strength gains are large enough to clear a session-to-session detection threshold, whereas a trained lifter’s gains may clear a monthly threshold but not a weekly one.
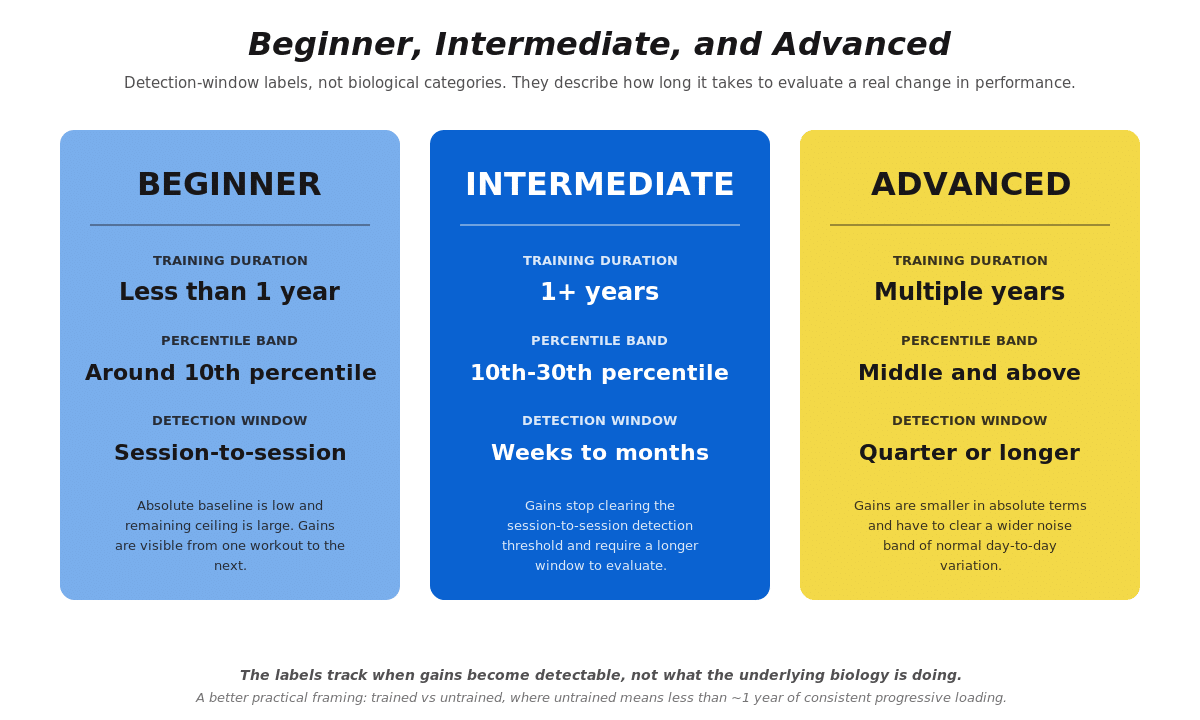
The labels are fine as a detection heuristic, but they do not describe anything else about the individual’s fitness, how they should progress, or what program they should run. The underlying adaptive processes do not change rate at any boundary between the tiers, which we discuss in Progressive Loading Part 3. Note that in that article we frame individuals as either trained or untrained, where untrained means less than roughly a year of consistent progressive loading and trained means everyone else. These labels are minimalist by design, as program design and progression strategies are highly individualized.
How does strength predict health outcomes?
Beyond performance benchmarks, strength is associated with many improvements in health. Two datasets anchor this picture.
The Aerobics Center Longitudinal Study discussed earlier is among the best evidence linking measured muscular strength to mortality risk in adults.3 The middle and upper thirds of muscular strength were associated with reduced all-cause and cancer mortality after adjusting for cardiorespiratory fitness and other confounders. The cardiovascular mortality association attenuated after fitness adjustment, suggesting the cardiovascular benefit of strength is partly mediated through aerobic fitness.
The PURE study followed 139,691 adults aged 35 to 70 across 17 countries.9 Each 5 kg lower handgrip strength was associated with a 17% higher risk of cardiovascular mortality and a 7% higher risk of non-cardiovascular mortality. Grip strength was a stronger predictor of all-cause and cardiovascular mortality in this dataset than systolic blood pressure. The relationship was not seen for incident diabetes, fractures, or fall injuries, suggesting grip strength is a specific signal of musculoskeletal and neuromuscular system integrity rather than a general health proxy.
Grip strength has earned a permanent place in clinical screening protocols because of these data, but it is a limited tool when applied to trained adults specifically. Much of the score reflects build, lean body mass, and genetics rather than current health. The standard cutoffs also disagree across the major sarcopenia frameworks: a 30 kg male grip is ‘sarcopenic’ under the U.S. SDOC definition and “normal” under the European EWGSOP2. Grip does not scale tightly with training in lifters who do not specifically train it. For the full treatment of grip strength as a clinical signal, including its limitations in trained populations and what to do when a number falls into a screening zone, see Sarcopenia: What It Is and How to Prevent It.
A more practical use of grip strength for adults outside the clinical sarcopenia screening conversation is the relative version: handgrip force divided by bodyweight. Relative grip strength tracks cardiometabolic outcomes (hypertension, metabolic syndrome, dyslipidemia) better than absolute grip strength.10 Targets in healthy adults run roughly above 0.66 (kg grip / kg bodyweight) for men and above 0.50 for women, with the broader picture available in the BBM Vital 5 framework linked above.
How should you actually use these numbers?
Strength standards earn their keep as orientation, but trying to use them as prescriptions is where the trouble starts. Three practical uses for a reader who lands on a percentile chart:
As a sanity check. If you have been training consistently for two years and your squat is still in the 5th percentile of the powerlifter dataset for your weight class and sex, that is a signal worth investigating. The most common explanations are insufficient training stimulus, technique that is not yet efficient enough to express the strength you have, recent or ongoing major life-stress disruptions, or a programming structure that is not loading the right variables. The signal is not “strength training doesn’t work for you”; the signal is “the training hasn’t matched what your physiology needs”, which is fixable.
As a communication shorthand. “My squat is in the 50th percentile for my weight class” tells another lifter or a coach roughly where you sit on the population curve. It is more useful than absolute pounds because it accounts for body mass.
As a longitudinal benchmark. Tracking your own movement across percentiles over time is more meaningful than comparing yourself to other lifters. Moving from the 30th to the 60th percentile in your weight class over three years tells you the program is working in a way that absolute pounds cannot when bodyweight is also changing.
What strength standards are not useful for:
As a target. The reader who concludes “I should be at the 75th percentile because that is what serious lifters achieve” is operating on a value judgment, not a physiological argument. Most adults will not reach the 75th percentile of competitive powerlifters, and that is fine. The largest health gains come from moving from the lowest third of strength to the middle third, not from moving from the upper third to elite.3
As a substitute for individualized programming. No percentile rank tells you whether your program is appropriate for your current capacity, recovery, or goals. The metric that matters for whether your training is working is whether your performance trend is upward against your own recent anchor from the past 4-8 weeks, not whether your absolute number sits above or below an aggregate distribution.
As evidence of what your body is biologically capable of. Genetic factors influence absolute strength substantially. Twin studies show that 50 to 60% of the variance in baseline muscular strength is heritable.13 A lifter at the 30th percentile after years of consistent training may be expressing their genetic ceiling appropriately; a lifter at the 90th percentile may have started with a different baseline. Neither outcome reflects a difference in how well someone responds to training.
Frequently asked questions
How strong should a beginner be?
Beginners do not need to be at any particular strength level before they start training. The starting strength of new lifters spans a wide range, driven by prior physical activity, body composition, age, and inherited factors. Whatever you can lift today is the right starting point. The relevant question is not whether you are strong enough to begin, but whether you are progressing once you do.
After one year of consistent progressive barbell training, recreational lifters typically achieve a 1-Repetition Maximum (1RM) squat in the range of bodyweight to 1.5× bodyweight, a bench press in the range of 0.7× to 1.1× bodyweight, and a deadlift in the range of 1.25× to 1.75× bodyweight, with substantial individual variation by sex, weight class, training history, and program design. These are population averages from recreational training environments and roughly correspond to the 10th percentile of competitive powerlifters in the same age and weight class.
How strong should I be after 3 years of consistent training?
The Latella longitudinal data on competitive powerlifters suggests cumulative gains of approximately 15 to 20% over the first three years of consistent competition-focused training.5 For recreational lifters with less time-dedicated training, gains tend to be somewhat smaller in cumulative magnitude but follow the same logarithmic curve: largest in year one, smaller in year two, smaller still in year three. A reasonable expectation after three years of consistent recreational training is to have moved from the 10th percentile band into the 30th-50th, with substantial individual variation.
What strength level am I?
Your strength level depends on the lift, your bodyweight, age, sex, training history, and how specifically you train the squat, bench press, and deadlift. Percentile charts can help orient you, but they should not be treated as a fixed verdict on your training or potential. The more useful question is whether your own lifts are trending upward over time under reasonably consistent training conditions.
Does more muscle always mean more strength?
No. Strength is the integrated output of muscle mass, neural drive, technical skill on the specific movement, and the lifter’s calibration to maximum effort. Muscle mass is a major contributor, and bigger muscles can produce more force, all else being equal. But two lifters with the same lean mass can express significantly different strength levels depending on how well they have trained the specific movement, how efficient their technique is, and how trained they are at producing maximal effort. Current data show that hypertrophy explains roughly 25% of individual variance in 1RM strength gains in trained men, with neural and skill factors accounting for the rest.11
What matters more, absolute strength or relative strength?
The data is mixed and depends on which outcome you are looking at. Absolute grip strength has been the stronger predictor of cardiovascular mortality in some large cohorts (PURE).⁹ Relative strength (strength divided by bodyweight) tracks cardiometabolic outcomes like hypertension, metabolic syndrome, and dyslipidemia better than absolute strength in others.¹⁰ The honest answer is that both matter, and the limited head-to-head data does not let us say one matters more than the other.
How do strength standards differ by age?
Strength peaks in the mid-20s to early 30s in most strength sports, then declines with age. The decline in trained populations is substantially slower than the decline in general populations who are not training. Trained masters athletes maintain or even gain strength into their 60s and lose it at roughly one-third the rate of sedentary peers in their 70s.5 The 90th-percentile male competitive powerlifter at age 80+ still squats 1.72× bodyweight and deadlifts 2.30× bodyweight; for women in the same band the numbers are 1.01× squat and 1.68× deadlift.4 For the underlying mechanism of why strength declines with age and what to do about it, see Sarcopenia: What It Is and How to Prevent It.
Is grip strength a useful health screen?
In large population-level mortality data, lower grip strength tracks with higher cardiovascular and all-cause mortality risk.⁹ For an adult who lands somewhere in the middle of the distribution, grip strength becomes much less informative because of how much of the score is driven by build, body mass, and genetics rather than current health. For the full treatment of grip strength’s strengths and limitations as a screening tool, see the grip strength and sarcopenia podcast.
What to do next
If you are using these numbers to orient your training, the next step depends on what you are trying to solve…
If you are newer to lifting, start with our
strength training guide.
If you want a broader explanation of resistance training, see
what strength training is.
References
1. Fiatarone MA, Marks EC, Ryan ND, Meredith CN, Lipsitz LA, Evans WJ. High-intensity strength training in nonagenarians: effects on skeletal muscle. JAMA. 1990;263(22):3029-3034. https://doi.org/10.1001/jama.1990.03440220053029
2. Fiatarone MA, O’Neill EF, Ryan ND, et al. Exercise training and nutritional supplementation for physical frailty in very elderly people. N Engl J Med. 1994;330(25):1769-1775. https://doi.org/10.1056/NEJM199406233302501
3. Ruiz JR, Sui X, Lobelo F, et al. Association between muscular strength and mortality in men: prospective cohort study. BMJ. 2008;337:a439. https://doi.org/10.1136/bmj.a439
4. van den Hoek DJ, Beaumont PL, van den Hoek AK, et al. Normative data for the squat, bench press and deadlift exercises in powerlifting: data from 809,986 competition entries. J Sci Med Sport. 2024;27(11):734-742. https://doi.org/10.1016/j.jsams.2024.07.005
5. Latella C, Owen PJ, Davies T, Spathis J, Mallard A, van den Hoek D. Strength adaptations across the lifespan in competitive powerlifters: a 15-year retrospective and longitudinal growth model. Sports Med. 2024;54(3):753-774. https://doi.org/10.1007/s40279-023-01962-6
6. Watson SL, Weeks BK, Weis LJ, Harding AT, Horan SA, Beck BR. High-intensity resistance and impact training improves bone mineral density in postmenopausal women: the LIFTMOR randomized controlled trial. J Bone Miner Res. 2018;33(2):211-220. https://doi.org/10.1002/jbmr.3284
7. Roberts BM, Nuckols G, Krieger JW. Sex differences in resistance training: a systematic review and meta-analysis. J Strength Cond Res. 2020;34(5):1448-1460. https://doi.org/10.1519/JSC.0000000000003521
8. Nuzzo JL. Narrative review of sex differences in muscle strength, endurance, activation, size, fiber type, and strength training participation rates, preferences, motivations, injuries, and neuromuscular adaptations. J Strength Cond Res. 2023;37(2):494-536. https://doi.org/10.1519/JSC.0000000000004329
9. Leong DP, Teo KK, Rangarajan S, et al. Prognostic value of grip strength: findings from the Prospective Urban Rural Epidemiology (PURE) study. Lancet. 2015;386(9990):266-273. https://doi.org/10.1016/S0140-6736(14)62000-6
10. Hao G, Chen H, Ying Y, Wu M, Yang G, Jing C. The relative handgrip strength and risk of cardiometabolic disorders: a prospective study. Front Physiol. 2020;11:719. https://doi.org/10.3389/fphys.2020.00719
11. Erskine RM, Fletcher G, Folland JP. The contribution of muscle hypertrophy to strength changes following resistance training. Eur J Appl Physiol. 2014;114(6):1239-1249. https://doi.org/10.1007/s00421-014-2855-4
12. Zempo H, Miyamoto-Mikami E, Kikuchi N, Fuku N, Miyachi M, Murakami H. Heritability estimates of muscle strength-related phenotypes: A systematic review and meta-analysis. Scand J Med Sci Sports. 2017;27(12):1537-1546. doi:10.1111/sms.12804
The post Strength Standards: How Strong Should You Be? appeared first on Barbell Medicine.